
Carbon Trust Verification: Empowering businesses towards a greener future
Company news
20 Jun, 2024
2 min
Understanding how your electricity is generated is crucial for reporting carbon emissions and showcasing sustainability. We provide a detailed fuel mix for our conventional products and our renewable products, ensuring transparency about your energy supply.
The charts below show our fuel mix for April 2024 to March 2025. Data for April 2025 to March 2026 will be available late 2026.
Our renewable products are powered by clean generation including natural sources such as wind, solar and hydro. Every megawatt hour we supply to customers on our renewable products is backed with a renewable origin certificate, independently verified by The Carbon Trust. Figures for our renewable fuel mix as illustrated in the chart are Biomass/Thermal 50%, Wind 50%.
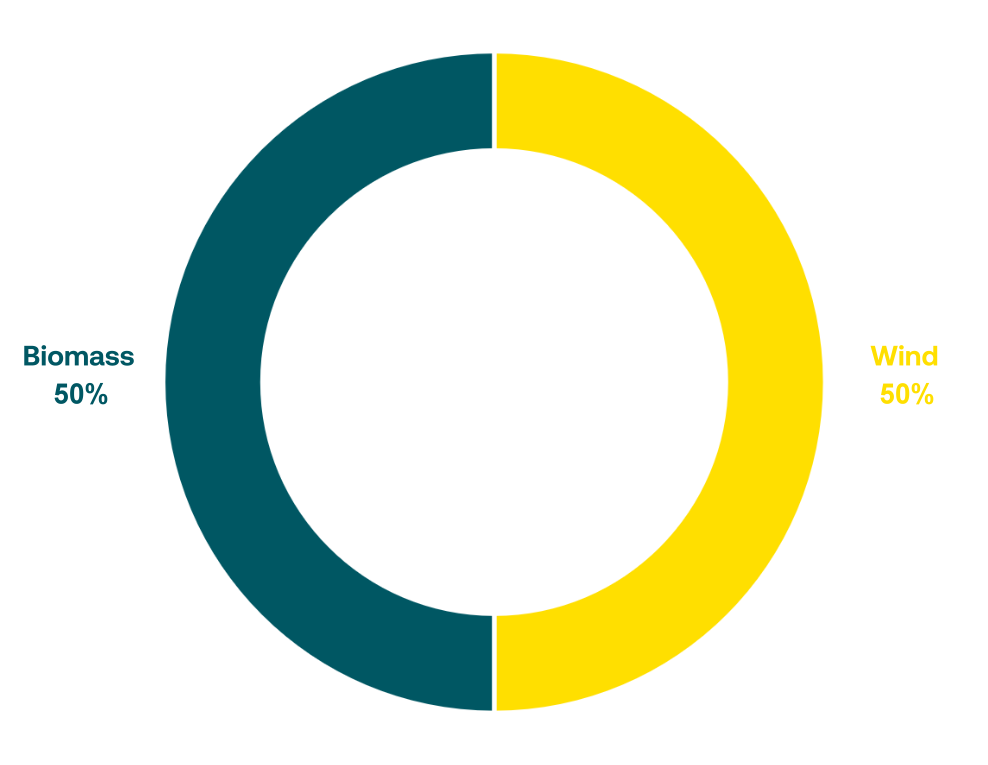
Our renewable electricity products offer unrivalled transparency and are independently verified by The Carbon Trust to confirm that every megawatt hour is backed by UK-recognised renewable certificates, which we aim to source from small renewable generation projects.
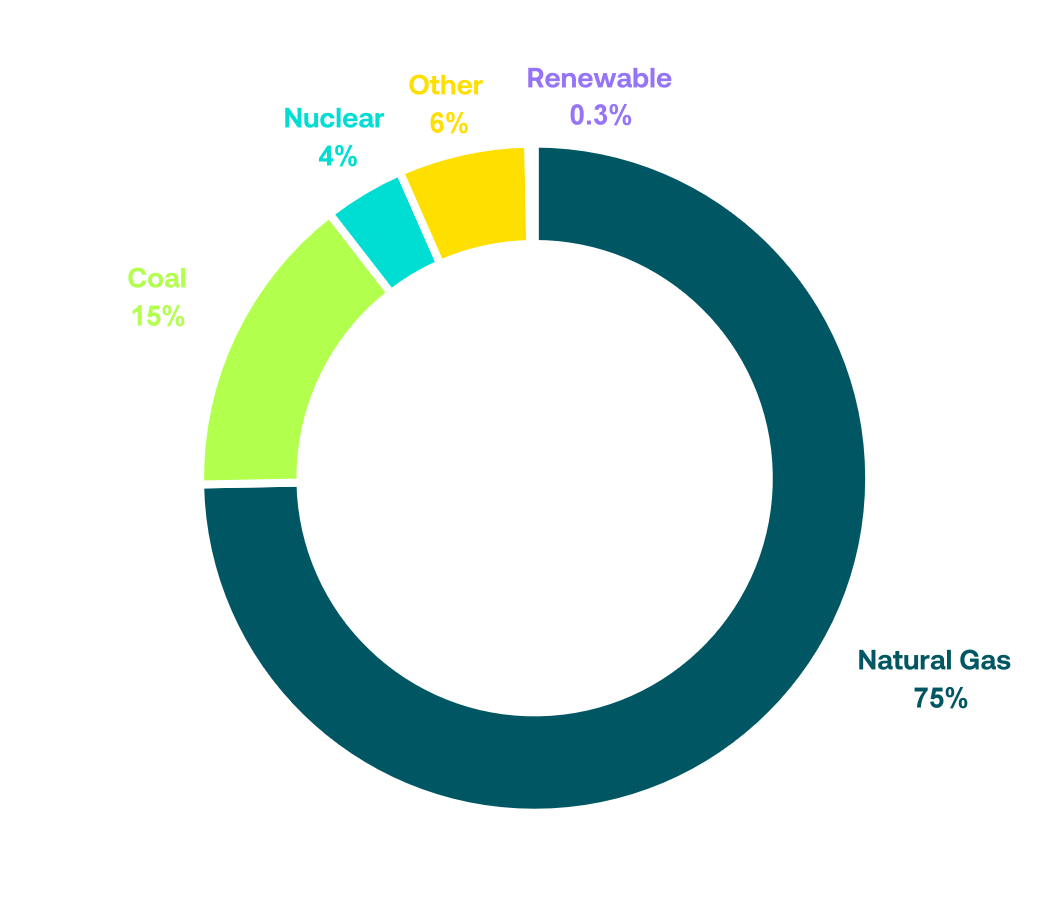
The residual fuel mix for our conventional products is predominantly from grid sources. Figures for our conventional fuel mix as illustrated in the chart are Natural Gas 75%, Coal 15%, Nuclear 4%, Other 6%, Renewables 0.3%.
Figures for total fuel mix of SmartestEnergy Business as illustrated in the chart are Natural Gas 69%, Coal 14%, Nuclear 4%, Other 6%, Biomass/Thermal 3.7%, Wind 3.8%, Hydro 0.007%, Solar 0.0040%.
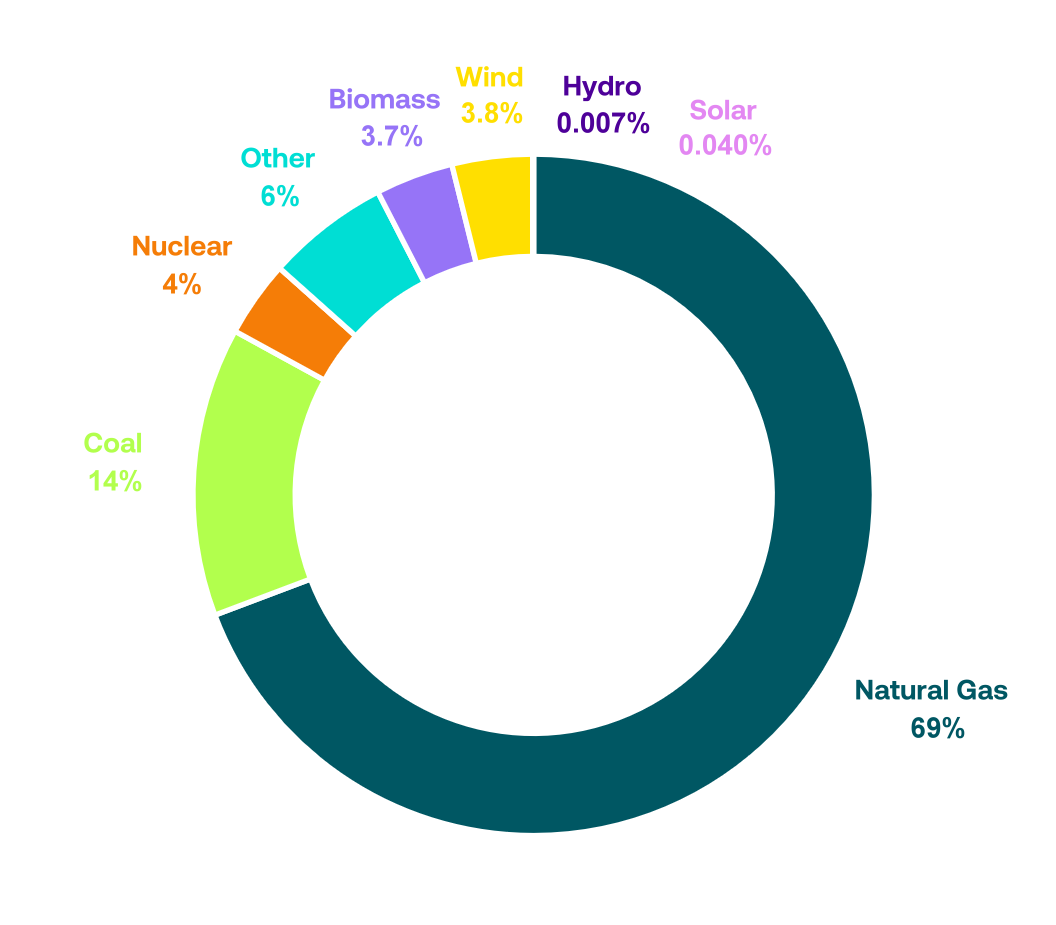
Scope 2 emissions: 446.044409 gCO2/kWh, Total radioactive waste: 0.000253 g/kWh.

If you're a small-medium business, you're in the right place.
Existing small-medium business customer?
If you're a generator or a commercial and industial (C&I) business you should visit our SmartestEnergy Limited website.
Existing large business customer?